Production checkpoint upgraded to v2f_122 on 2026-05-24.
These plots reflect the R8 baseline (v2f_109). Newer evaluations
against v2f_122 supersede this for production decisions. Kept here
for historical reference and to anchor the F1 / MAE regression test.
Reading the plots. Time-series traces compare predicted (orange)
vs ground-truth
actual_clean (blue) wrench components
Fx, Fy, Fz over the episode timeline.
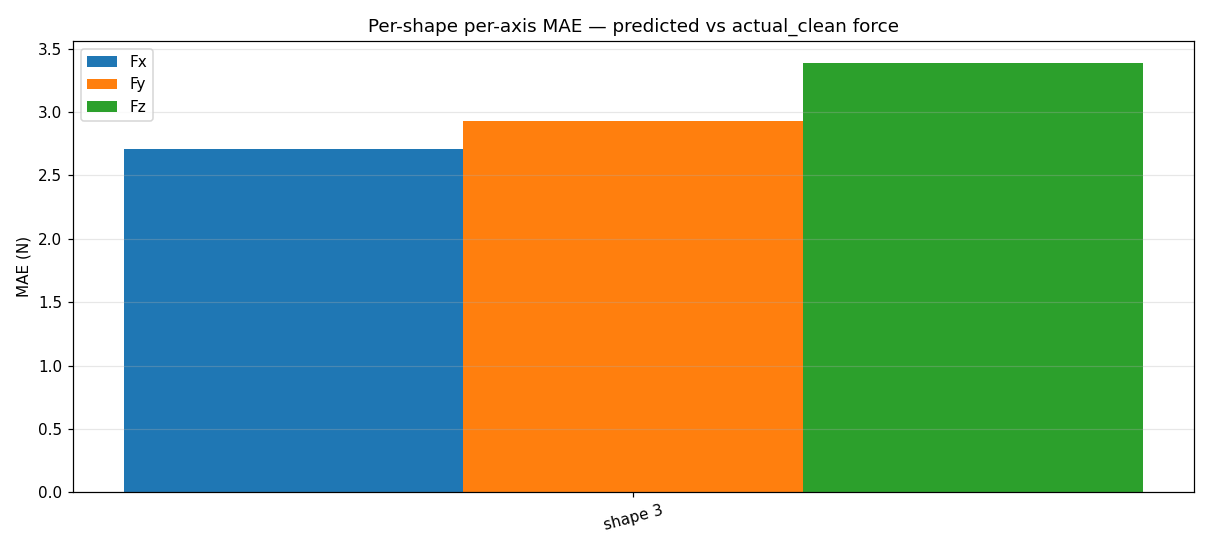
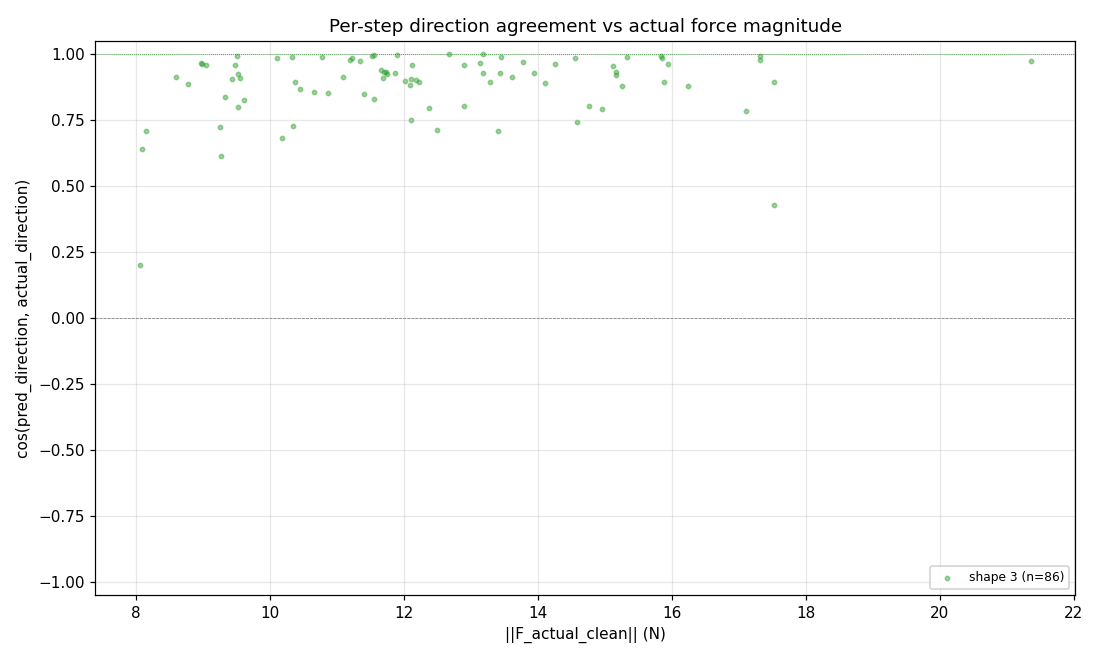
Per-shape MAE bar aggregates across the val split; the scatter shows
direction-cosine accuracy as a function of force magnitude.
Summary
checkpoint
v2f_109_3shape_optY_seed7
val split
fmb_real/val
temporal window
K=1 (single-frame)
shape
3 · 4 episodes shown
Per-shape MAE (shape 3, mean over val)
| component | MAE (N) |
|---|---|
| Fx | 2.710 |
| Fy | 2.932 |
| Fz | 3.390 |
Aggregate plots
Episode time-series (shape 3)
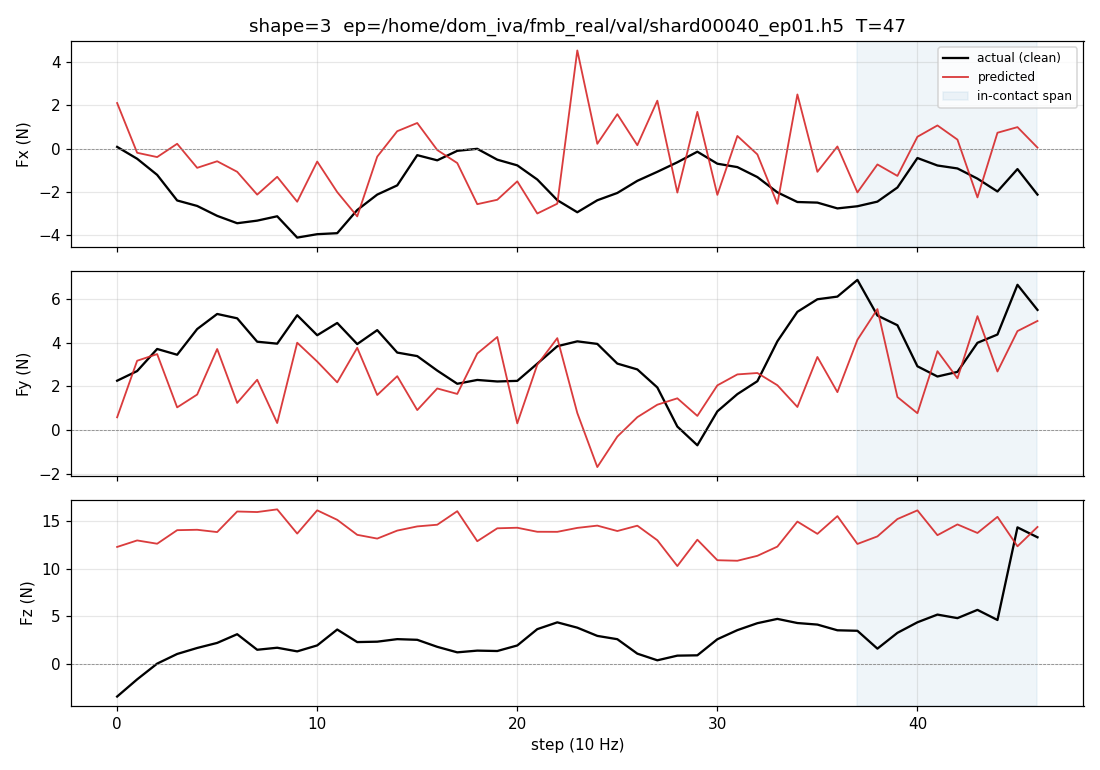
actual_clean for Fx, Fy, Fz.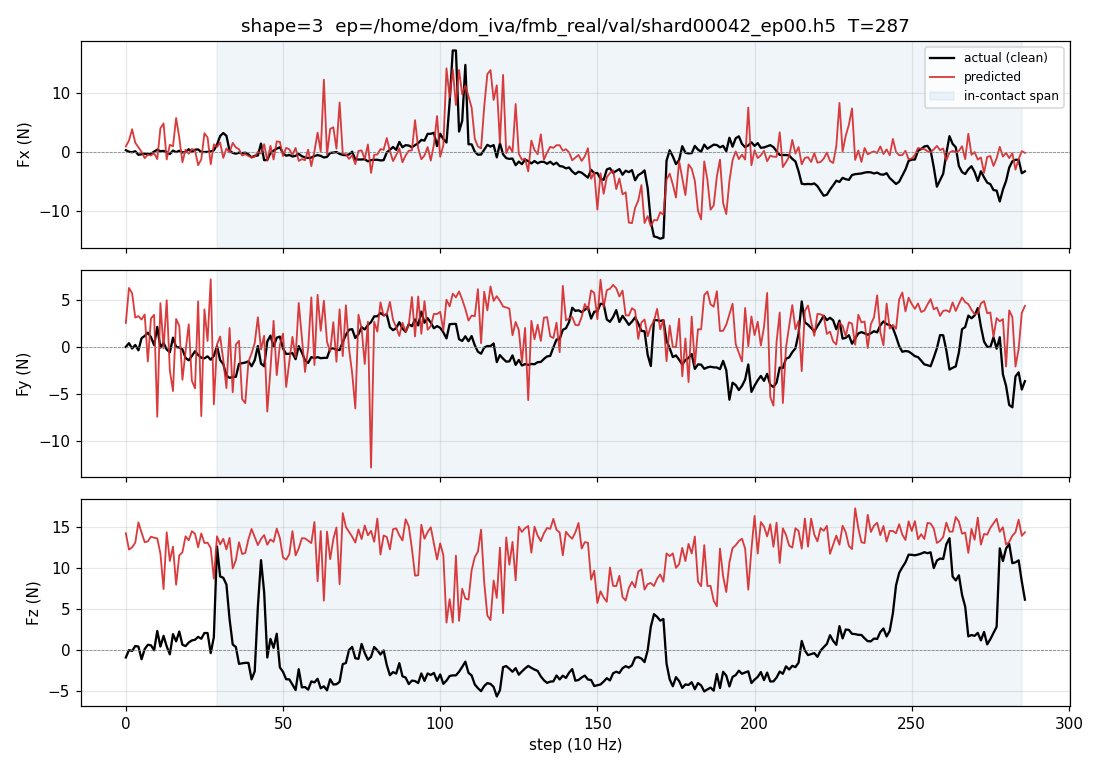
actual_clean for Fx, Fy, Fz.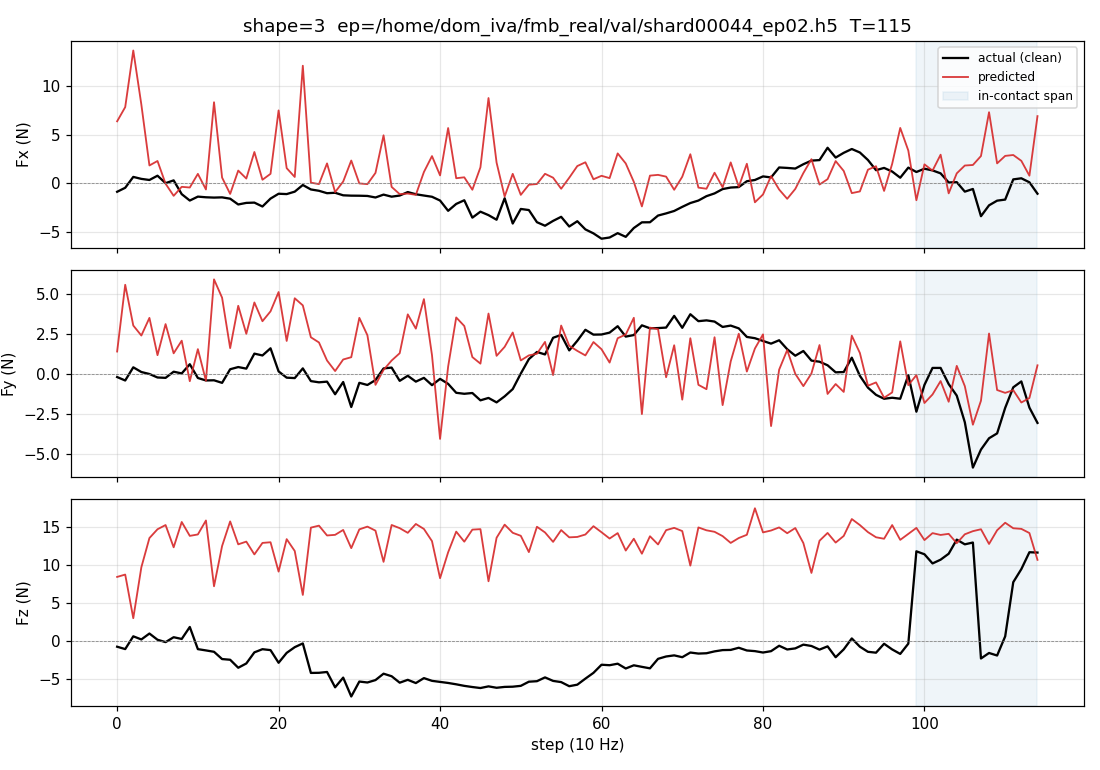
actual_clean for Fx, Fy, Fz.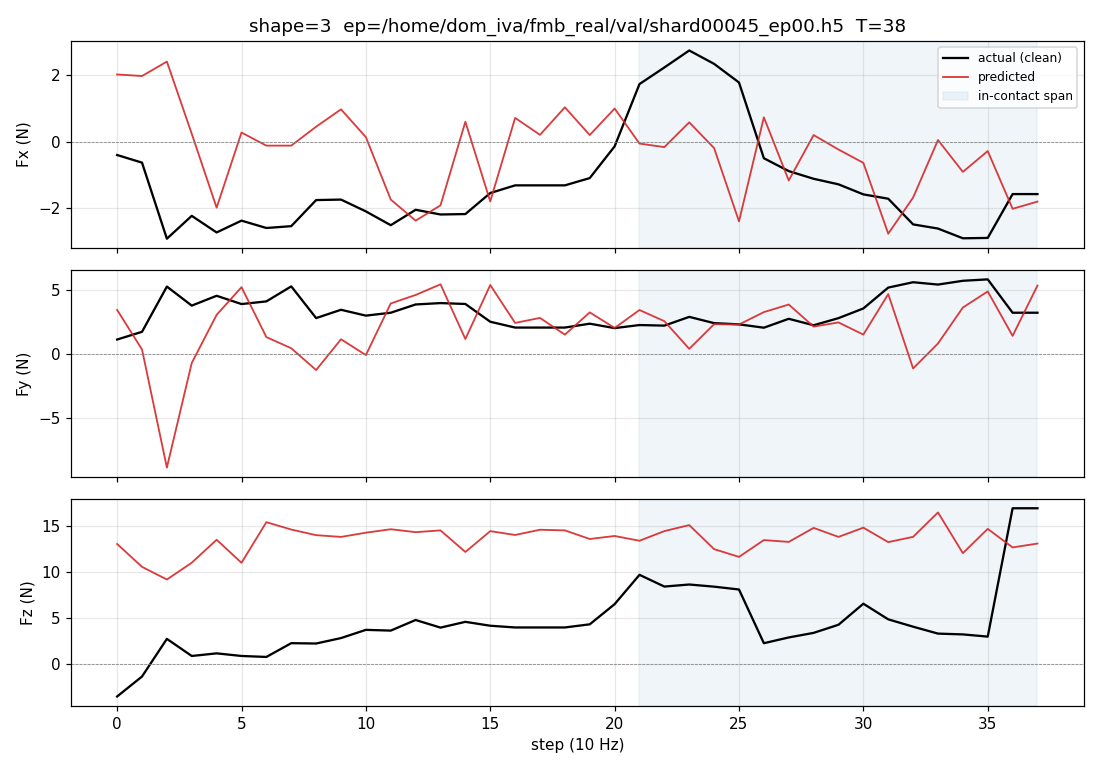
actual_clean for Fx, Fy, Fz.Source data
| artifact | path |
|---|---|
| index manifest | index.json (this directory) |
| checkpoint | outputs/v2f_109_3shape_optY_seed7/checkpoints/predictor_final.pt |
| val data | /home/dom_iva/fmb_real/val (DL_A6000) |
| NAS FTP archive | ftp://143.248.121.169:7002/IntelligentManipulationTeam/DomrachevIvan/ · path under r8_force_comparison/ |